
Index
 |
 |
Site Index |

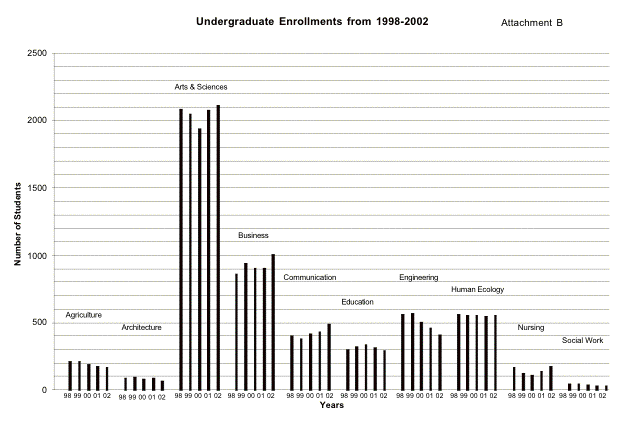
Undergraduate Enrollments (1998-2002). For the most part, enrollment has been fairly stable within colleges across the 5 years from 1998-2002. The College of Engineering was the only college to show a decreasing trend in enrollment, and the Colleges of Business and Communications showed increasing enrollment trends (Attachment B: Undergraduate Enrollment 1998-2002). Student enrollment by year in school (i.e. freshman sophomore, junior, senior) was striking in that in each college over half of the summer school students were seniors (>90 hours). The second highest group were sophomores (31-59 hours) followed by juniors (60-89 hours) and freshmen (1-30 hours) (Attachment C: Enrollment by Class 1998-2002).
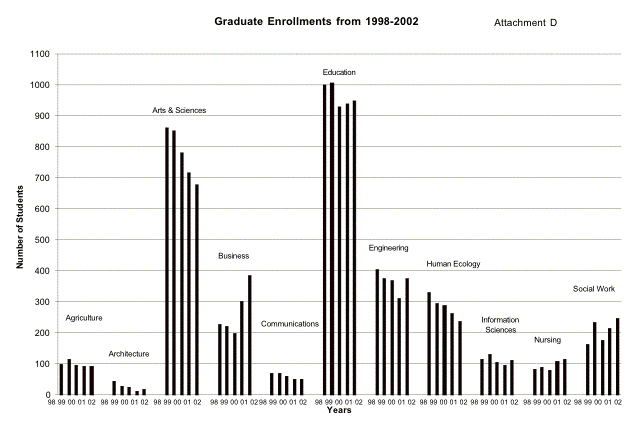
Graduate Enrollment (1998-2002). Graduate enrollments from 1998-2002 were marked by more variability than undergraduate enrollments (Attachment D Graduate Enrollments 1998-2002). Arts and Sciences and Human Ecology had notable declines in enrollments. Engineering graduate enrollments declined from 1998-2001 but increased substantially in 2002. The Colleges of Business, Nursing, and Social Work all had enrollment increases. For Nursing and Social Work these were five year trends, but for Business, the substantial increases in enrollment occurred in the last two years.
Individual Course Enrollments. Summer 2002 enrollment data showed a large percentage of individual courses with below the recommended minimums at both the undergraduate and graduate levels. Forty-four percent of undergraduate classes were below the recommended minimum of 15 students and forty-four percent of graduate classes were below the recommended minimum of 9 students.
Department Head Questionnaire. A brief questionnaire was sent to university department heads asking them to rate the importance of their decisions on which summer school courses to offer. (Attachment E: Department Head Questionnaire) We also asked if their department would or could offer additional summer school courses given the other responsibilities of faculty, such as research. Fifty department heads of 62 mailed returned the questionnaire. The majority of department heads indicated the budget was the most important consideration in deciding on summer school courses, closely followed by undergraduate program needs and anticipated enrollment. Department heads indicated very modest support for offering additional summer school courses with twelve of the department heads from across campus indicating they could offer more summer courses. Reasons for offering additional summer courses were to meet both undergraduate and graduate needs. Reasons given for not offering more summer courses were that the current summer offerings were sufficient, little faculty interest, the department traditionally did not offer summer courses, and lack of student demand.
|
Educational and General Fund (E&G) Expenditures |
|||||
|
And Revenues for May, June, & July 2002 |
|
||||
|
|
|
|
|
|
|
|
Expenditure
Function |
|
|
|
|
|
|
Academic Support |
|
|
|
$10,152,644 |
|
|
Institutional Support |
|
|
|
2,765,960 |
|
|
Instruction |
|
|
|
38,213,721 |
* |
|
Operation and Maintenance |
|
|
11,727,104 |
|
|
|
Other Expenditures |
|
|
|
1,550,408 |
|
|
Public Service |
|
|
|
3,643,784 |
|
|
Research |
|
|
|
3,990,701 |
|
|
Scholarships &
Fellowships |
|
|
2,465,883 |
|
|
|
Student Services |
|
|
|
3,467,443 |
|
|
Total Expenditures |
|
|
|
$77,977,648 |
|
|
|
|
|
|
|
|
|
Less: 9
month academic salaries (incl benefits) |
|
(21,720,484) |
* |
||
|
|
|
|
|
|
|
|
May,
June, & July Net Expenditures |
|
$56,257,164 |
|
||
|
|
|
|
|
|
|
|
Total Summer School Direct Pay |
|
|
3,265,152 |
|
|
|
Total Net
Expenditures |
|
|
|
|
$59,522,316 |
|
|
|
|
|
|
|
|
Summer
Income |
|
|
|
|
|
|
F&A Charges May,
June, & July 2002 |
|
$4,638,168 |
|
||
|
Prorate State
Appropriations |
|
|
40,326,800 |
|
|
|
Summer School Fee Income |
|
|
12,070,046 |
|
|
|
Total Income Summer
|
|
|
|
|
$57,035,014 |
|
|
|
|
|
|
|
|
Net
Expenditures Over Revenues for Summer 2002 |
|
($2,487,302) |
|||
|
|
|
|
|
|
|
|
|
|
|
|
|
|
|
*Instruction
expenditure function includes the salaries and operating for academic units. |
|||||
|
The 9 month salaries in the academic
units are deducted after Total Expenditures. |
|||||
|
|
|
|
|
|
|

UNDERGRADUATE STUDENT ENROLLMENT Attachment C
|
|
|
|
|
|
|
|
COLLEGE |
|
|
|
|
|
|
AGRICULTURE |
FRESHMAN |
SOPHOMORE |
JUNIOR |
SENIOR |
TOTAL |
|
1998 |
19 |
47 |
32 |
121 |
219 |
|
1999 |
12 |
50 |
36 |
120 |
218 |
|
2000 |
9 |
50 |
23 |
110 |
192 |
|
2001 |
11 |
41 |
24 |
105 |
181 |
|
2002 |
12 |
42 |
17 |
100 |
171 |
|
|
|
|
|
|
|
|
ARCHITECTURE |
FRESHMAN |
SOPHOMORE |
JUNIOR |
SENIOR |
TOTAL |
|
1998 |
11 |
31 |
12 |
37 |
91 |
|
1999 |
4 |
36 |
23 |
37 |
100 |
|
2000 |
4 |
26 |
21 |
35 |
86 |
|
2001 |
5 |
34 |
15 |
40 |
94 |
|
2002 |
4 |
20 |
11 |
35 |
70 |
|
|
|
|
|
|
|
|
ARTS AND SCIENCES |
FRESHMAN |
SOPHOMORE |
JUNIOR |
SENIOR |
TOTAL |
|
1998 |
115 |
532 |
271 |
1172 |
2090 |
|
1999 |
86 |
524 |
261 |
1181 |
2052 |
|
2000 |
95 |
489 |
262 |
1097 |
1943 |
|
2001 |
111 |
528 |
251 |
1190 |
2080 |
|
2002 |
95 |
551 |
249 |
1226 |
2121 |
|
|
|
|
|
|
|
|
BUSINESS ADM |
FRESHMAN |
SOPHOMORE |
JUNIOR |
SENIOR |
TOTAL |
|
1998 |
71 |
221 |
138 |
433 |
863 |
|
1999 |
54 |
257 |
156 |
477 |
944 |
|
2000 |
59 |
227 |
153 |
472 |
911 |
|
2001 |
49 |
233 |
138 |
485 |
905 |
|
2002 |
61 |
266 |
153 |
533 |
1013 |
|
|
|
|
|
|
|
|
COMMUNICATION |
FRESHMAN |
SOPHOMORE |
JUNIOR |
SENIOR |
TOTAL |
|
1998 |
17 |
134 |
43 |
208 |
402 |
|
1999 |
19 |
116 |
50 |
200 |
385 |
|
2000 |
18 |
109 |
63 |
233 |
423 |
|
2001 |
22 |
121 |
51 |
244 |
438 |
|
2002 |
24 |
134 |
59 |
273 |
490 |
|
|
|
|
|
|
|
|
EDUCATION |
FRESHMAN |
SOPHOMORE |
JUNIOR |
SENIOR |
TOTAL |
|
1998 |
18 |
86 |
34 |
169 |
307 |
|
1999 |
31 |
55 |
45 |
196 |
327 |
|
2000 |
20 |
86 |
46 |
187 |
339 |
|
2001 |
15 |
80 |
38 |
188 |
321 |
|
2002 |
14 |
85 |
42 |
153 |
294 |
|
|
|
|
|
|
|
|
|
|
|
|
|
|
|
ENGINEERING |
FRESHMAN |
SOPHOMORE |
JUNIOR |
SENIOR |
TOTAL |
|
1998 |
34 |
136 |
88 |
307 |
565 |
|
1999 |
48 |
127 |
111 |
289 |
575 |
|
2000 |
33 |
120 |
83 |
272 |
508 |
|
2001 |
43 |
110 |
54 |
257 |
464 |
|
2002 |
27 |
112 |
67 |
207 |
413 |
|
HUMAN ECOLOGY |
FRESHMAN |
SOPHOMORE |
JUNIOR |
SENIOR |
TOTAL |
|
1998 |
16 |
160 |
67 |
324 |
567 |
|
1999 |
14 |
138 |
72 |
338 |
562 |
|
2000 |
10 |
164 |
58 |
323 |
555 |
|
2001 |
17 |
126 |
56 |
350 |
549 |
|
2002 |
10 |
141 |
52 |
354 |
557 |
|
|
|
|
|
|
|
|
INFORM SCIENCES |
FRESHMAN |
SOPHOMORE |
JUNIOR |
SENIOR |
TOTAL |
|
1998 |
|
|
|
|
|
|
1999 |
|
|
|
|
|
|
2000 |
|
|
|
|
|
|
2001 |
|
|
|
|
|
|
2002 |
|
|
|
|
|
|
|
|
|
|
|
|
|
NURSING |
FRESHMAN |
SOPHOMORE |
JUNIOR |
SENIOR |
TOTAL |
|
1998 |
16 |
57 |
44 |
58 |
175 |
|
1999 |
10 |
50 |
29 |
42 |
131 |
|
2000 |
7 |
43 |
25 |
40 |
115 |
|
2001 |
11 |
45 |
29 |
55 |
140 |
|
2002 |
18 |
49 |
31 |
80 |
178 |
|
|
|
|
|
|
|
|
SOCIAL WORK |
FRESHMAN |
SOPHOMORE |
JUNIOR |
SENIOR |
TOTAL |
|
1998 |
5 |
17 |
5 |
24 |
51 |
|
1999 |
5 |
10 |
9 |
28 |
52 |
|
2000 |
1 |
19 |
10 |
12 |
42 |
|
2001 |
1 |
11 |
5 |
20 |
37 |
|
2002 |
3 |
12 |
4 |
18 |
37 |

Please rate each of the following items on its importance when you
decide whether to offer a summer course.
Very Not
at All
Important Important Important
5
4
3
2
1
______ Faculty
Preference
______ Summer Budget
______ Anticipated
Course Enrollment
______ Course was not
offered during the regular academic year
______ Specific graduate
program Need
______ Specific undergraduate
program need
______ Part time student
needs (e.g. teacher continuing education for certification)
______ Other (please
specify)
Your
Department:___________________________________________
Please Return by March 10 to:
Richard Saudargas
Psychology Department