

Index
|
|
|
Site Index |

Athletics Committee
April 2001
A Report on Student-Athlete Academic Performance
Issued by
Faculty Senate Athletics Committee
April 9, 2001
| Authors: | Daniel P. Murphy, Associate Professor of Accounting Thomas Galligan, Professor and Dean of the Law School Betsey Kirk, Student Government Association Representative Jeff MacCabe, Professor of Molecular Biology |
Academic Performance
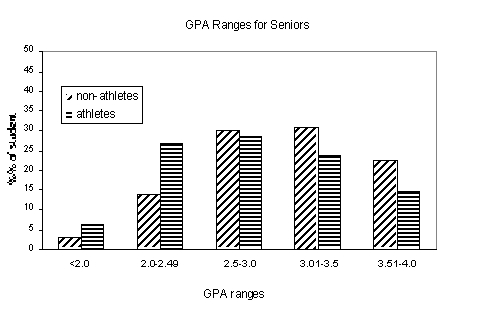
Unlike prior reports, the 2001 report cut-off cycle was not December. This year's report uses a cut-off cycle of the end of the second summer semester. Thus this year's data is based on a full academic year's worth of grades rather than simply one semester. While the increased pool of grades is a plus because it provides a larger sample size, one must beware not to try and compare conclusions or data from this year's report to earlier reports.Figure 1
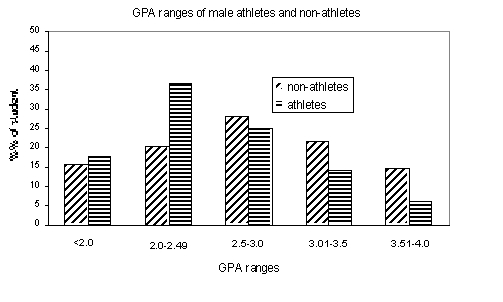
Figure 2
The Interview and Survey Results
The subcommittee developed a form survey that is included in the Appendix. The survey focused on three areas: the general academic environment at UT; the academic experience of the student athlete at UT; and UT athletes' use of academic support facilities. Each area of the survey consisted of a series of statements, see survey form, and the subject was asked to express his or her agreement or disagreement with the statement, expressed as a number ranging from 1 - 5. (1=Strongly agree, 2= Agree, 3=Neither agree nor disagree; 4 =Disagree; 5=Strongly disagree).Profile of Freshman Student Athletes
Concerns have been raised about the academic profile of incoming student athletes. In Table 8, the mean high school GPA and ACT equivalent scores are set forth for incoming athletes in various sports and for non-athletes as of fall 2000. To protect the confidentiality of the athletes it was necessary to group certain men's and women's sports together before computing these averages.Acknowledgements
The committee could not have completed its work without the data collection assistance provided by Salim Bradley, Carmen Tegano, Kerry Howland, Malcolm McInnis and Pam Hindle.Table 1
Cumulative GPA for Non-Athletes and Athletes
Item |
August 2000 Non-Athletes |
August 2000 Athletes |
August 1999 Athletes |
| Population Size Mean GPA Standard Deviation |
20,332 students 2.81 .75 |
594 students 2.70 .69 |
546 students 2.72 .65 |
Table 2
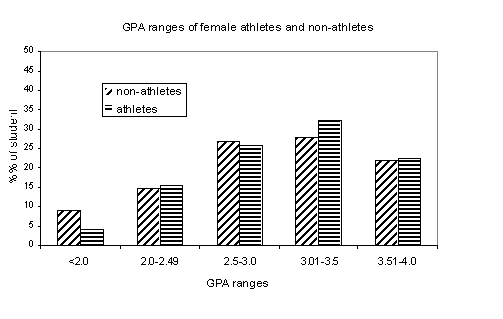
Cumulative GPA for Non-Athletes and Athletes by Gender
Item |
August 2000 Non-Athletes |
August 2000 Athletes |
August 1999 Athletes |
| Female | |||
| Population Size Mean GPA Std. Deviation |
10,307 students 2.93 .71 |
240 students 3.04 .59 |
225 students 3.00 .63 |
| Male | |||
| Population Size Mean GPA Std. Deviation |
10,025 students 2.68 .78 |
354 students 2.47 .66 |
321 students 2.52 .59 |
Table 3A
Cumulative GPA for Non-Athletes and Athletes by Class Standing
Item |
August 2000 Non-Athletes |
August 2000 Athletes |
August 1999 Athletes |
| Freshman | |||
| Population Size Mean GPA Std. Deviation |
2,503 students 1.98 .96 |
79 students 2.19 .90 |
87 students 2.24 .70 |
| Sophomore | |||
| Population Size Mean GPA Std. Deviation |
4,234 students 2.74 .75 |
184 students 2.74 .67 |
149 students 2.79 .64 |
| Junior | |||
| Population Size Mean GPA Std. Deviation |
4,198 students 2.85 .67 |
145 students 2.77 .62 |
124 students 2.76 .60 |
| Senior | |||
| Population Size Mean GPA Std. Deviation |
9,937 students 3.04 .55 |
186 students 2.82 .56 |
186 students 2.87 .57 |
Table 3B
Cumulative GPA for Female Non-Athletes and Athletes by Class Standing
Item |
August 2000 Non-Athletes |
August 2000 Athletes |
August 1999 Athletes |
| Freshman | |||
| Population Size Mean GPA Std. Deviation |
1,147 students 2.16 .94 |
19 students 2.57 .70 |
28 students 2.43 .83 |
| Sophomore | |||
| Population Size Mean GPA Std. Deviation |
2,227 students 2.85 .72 |
88 students 3.04 .61 |
58 students 3.21 .56 |
| Junior | |||
| Population Size Mean GPA Std. Deviation |
2,189 students 2.96 .63 |
55 students 3.21 .54 |
50 students 2.99 .61 |
| Senior | |||
| Population Size Mean GPA Std. Deviation |
4,744 students 3.13 .52 |
78 students 3.04 .50 |
89 students 3.06 .49 |
Table 3C
Cumulative GPA for Male Non-Athletes and Athletes by Class Standing
Item |
August 2000 Non-Athletes |
August 2000 Athletes |
August 1999 Athletes |
| Freshman | |||
| Population Size Mean GPA Std. Deviation |
1,356 students 1.83 .95 |
60 students 2.08 .93 |
59 students 2.15 .62 |
| Sophomore | |||
| Population Size Mean GPA Std. Deviation |
2,007 students 2.62 .76 |
96 students 2.46 .60 |
91 students 2.52 .53 |
| Junior | |||
| Population Size Mean GPA Std. Deviation |
2,009 students 2.73 .68 |
90 students 2.49 .51 |
74 students 2.60 .54 |
| Senior | |||
| Population Size Mean GPA Std. Deviation |
4,653 students 2.94 .57 |
108 students 2.66 .55 |
97 students 2.69 .57 |
Table 4A
Cumulative GPA for All Athletes
by Scholarship Status
Item |
August 2000 Athletes |
August 1999 Athletes |
| Full Scholarship | ||
| Population Size Mean GPA Std. Deviation |
157 students 2.62 .56 |
178 students 2.63 .56 |
| Partial Scholarship | ||
| Population Size Mean GPA Std. Deviation |
198 students 2.90 .61 |
195 students 2.91 .62 |
| Non-Scholarship | ||
| Population Size Mean GPA Std. Deviation |
239 students 2.58 .80 |
172 students 2.60 .72 |
Table 4B
Cumulative GPA for Female Athletes
by Scholarship Status
Item |
August 2000 Athletes |
August 1999 Athletes |
| Full Scholarship | ||
| Population Size Mean GPA Std. Deviation |
63 students 2.96 .58 |
64 students 3.05 .52 |
| Partial Scholarship | ||
| Population Size Mean GPA Std. Deviation |
78 students 3.19 .52 |
95 students 3.08 .62 |
| Non-Scholarship | ||
| Population Size Mean GPA Std. Deviation |
99 students 2.98 .62 |
65 students 2.86 .71 |
Table 4C
Cumulative GPA for Male Athletes
by Scholarship Status
Item |
August 2000 Athletes |
August 1999 Athletes |
| Full Scholarship | ||
| Population Size Mean GPA Std. Deviation |
94 students 2.40 .42 |
114 students 2.39 .44 |
| Partial Scholarship | ||
| Population Size Mean GPA Std. Deviation |
120 students 2.71 .59 |
100 students 2.74 .58 |
| Non-Scholarship | ||
| Population Size Mean GPA Std. Deviation |
140 students 2.30 .79 |
107 students 2.45 .68 |
Table 5
Cumulative GPA by Sport
Sport |
August 2000 Athletes |
August 1999 Athletes |
| Female | ||
| Basketball Cross-Country Golf Track Rowing Soccer Softball Swimming Tennis Volleyball |
2.85 3.18 3.37 2.75 3.06 3.16 2.76 3.31 3.08 3.16 |
2.79 n/a 3.14 2.83 2.97 3.24 2.60 3.27 3.11 3.13 |
| Male | ||
| Baseball Basketball Football Golf Track Swimming Tennis |
2.53 2.20 2.32 2.96 2.56 2.87 3.02 |
2.54 2.48 2.40 2.63 2.66 2.78 3.02 |
Table 6
College Affiliation of Athletes
College |
August 2000 Athletes |
August 1999 Athletes |
| Communications Architecture Nursing University Studies Agriculture Business Administration Education Engineering Human Ecology Arts and Sciences Social Work Total |
38 2 9 168 13 73 63 28 34 165 1 594 |
26 3 5 143 16 87 56 31 36 140 3 546 |
Table 7A
Student-Athletes' Academic Experience: Survey Responses
| General Academic Experiences | Average |
Std. Deviation |
| A. My classroom instructors are generally accessible and willing to meet with me. | 1.82 | 0.056 |
| B. I receive effective academic advising from my academic department or college. | 2.14 | 0.091 |
| C. I receive high quality in-class instruction in my courses at UT. | 2.27 | 0.064 |
| D. Overall, I am receiving a high quality education at UT. | 2.07 | 0.058 |
| E. The overall academic and non-academic preparation I am receiving at UT will prepare me for life outside the university. | 1.87 | 0.079 |
| Academic Issues Unique to the Student-Athlete | Average |
Std. Deviation |
| A. I am treated better by my classroom instructors because I am a student-athlete. | 3.57 | 1.001 |
| B. I am treated worse by my classroom instructors because I am a student-athlete. | 3.44 | 1.057 |
| C. I am treated better by my fellow students because I am a student-athlete. | 2.82 | 0.919 |
| D. I am treated worse by my fellow students because I am a student-athlete. | 3.65 | 0.848 |
| E. My coaches clearly articulate their academic expectations of me. | 1.73 | 0.759 |
| F. My coaches hold me accountable for my academic responsibilities including attending class, maintaining my grades, etc. | 1.37 | 0.541 |
| G. I am a better student during the athletic season than during the off-season. | 2.99 | 1.042 |
Table 7B
Student-Athletes' Academic Support Services: Survey Responses
| Use of Academic Support Facilities Provided by the Office of Student Life | Average |
Std. Deviation |
| A. On average, how many times per week do you use the academic support resources provided by the Office of Student Life. | 3.64 | 3.132 |
| B. I receive effective academic tutoring from the Student Life. | 2.18 | 0.899 |
| C. I receive the effective advising from the Student Life advisors. | 1.90 | 0.89 |
| D. Overall, the study facilities and tools available in the Student Life offices meet my academic needs. | 2.01 | 0.947 |
| E. The Student Life academic support personnel are accessible and willing to meet with me. | 1.79 | 0.727 |
| F. Overall, I am satisfied with the quality of academic support I have. | 1.70 | 0.767 |
Table 8
Academic Profile of Fall 2000 Incoming Freshman Class
Description |
Mean High School GPA |
Mean ACT Equivalent Score |
|
| Non-Athletes | 3.35 | 24.00 | |
| Athletes | |||
| Football Track--Men All Other Men's Sports Basketball--Men & Women Track--Women All Other Women's Sports |
2.87 2.93 3.20 3.20 3.76 3.40 |
18.68 21.62 21.25 18.17 22.75 22.92 |
Figure 3
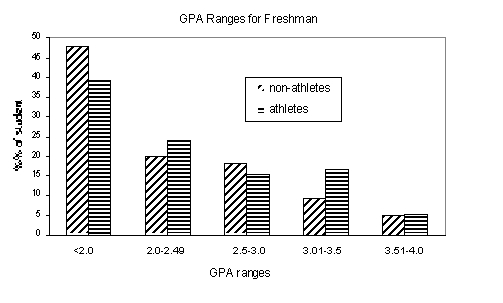
Figure 4
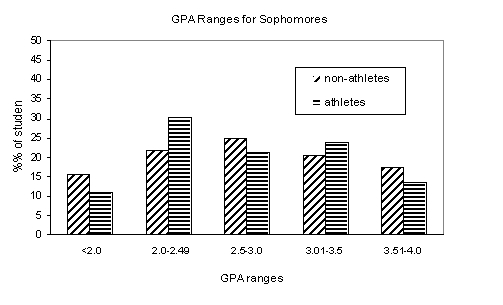
Figure 5
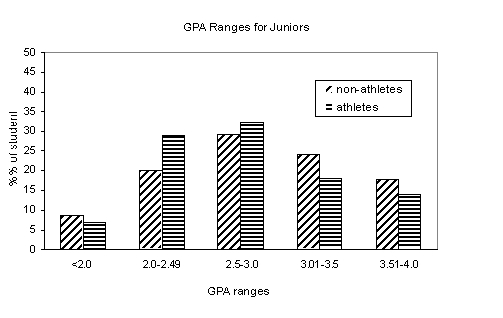
Figure 6
Appendix to the Report
| Senate Directory Officers Committees Members |
Governing Documents Senate Bylaws Faculty Handbook Tenure Policy |
Search
Reports |
Calendar
Archives |
Resources
Senate Home |